
Visualization – a key to understanding data
5 December 2023
In today’s dynamic business world, collecting large data sets has become an integral part of running an enterprise. However, the mere collection of data is not enough to unleash its potential. The key to success is to properly analyze information and draw accurate conclusions. Fortunately, today this can be achieved through automated data visualizations.
There are many tools available which offer various forms of data visualization. What are the advantages of using Business Intelligence systems and why is it so important to properly combine data with the right visualization? You can find out in our article.
Data visualization tools
Data visualization tools are crucial to effectively manage information, the volume of which is growing exponentially. As a result, business intelligence systems are becoming increasingly popular. There are many data visualization programs, both free and commercial, available nowadays. The most popular ones include: Power BI, Tableau, Looker Studio or D3.js. The choice of a tool depends on company needs, users’ level of sophistication and the type of data to be presented.
„Business Intelligence solutions allow processing of various sets of data– from small to huge ones. The data can come from a variety of areas, be it the financial performance of a medium-sized company, card-payroll analysis of individual departments of a large corporation, or verification of the status of processes maintained. BI class tools enable analysis and visualization of data in a user-friendly way. Depending on the needs, they help create simple or more complex reports, the purpose of which is, among others: to facilitate accurate business decisions, validate the quality of data or track the progress of processes, if only in the form of a progress bar.”
explains Anna Rotarska-Mizera, Team Leader and Senior Data Analyst at 3Soft
„Data to be used in visualizations can be diverse. It can be downloaded directly from databases or clouds, stored in spreadsheets or even in emails. Nothing prevents combining different data sources and presenting them in a unified way. An important feature of BI solutions is also the ability to customize reports. Also including the visual aspect, such as company identification data. Another advantage is the ability to use a data platform that allows access to reports at any time, and also on mobile devices.“
The expert adds.
Forms and ways of visualizing data
Regardless of the tool chosen, an important issue is the right choice of the form of data visualization. This is because its selection determines whether the visualized data will be comprehensible.
One of the basic forms of data visualization is a table, which allows for an orderly and clear presentation of information. Composed of columns and rows in each cell, it presents a specific value relating to the variables involved. This form is useful for presenting small numerical orders, comparisons between different elements, analyzing trend or preparing summaries. Due to its structure, the table allows you to quickly understand patterns and relationships in the data.
The knowledge presented in the table can be supplemented by charts. They allow quick and clear representation of the information coming from data analysis. Sometimes the information contained in a table changes its meaning when presented in a chart (e.g., Ascombe’s quartet). Popular types of charts include: a bar chart, a pie chart and a line chart. The choice of a chart depends on: data characteristics, the needs of a user and the end user of the indicated visualization, and more.
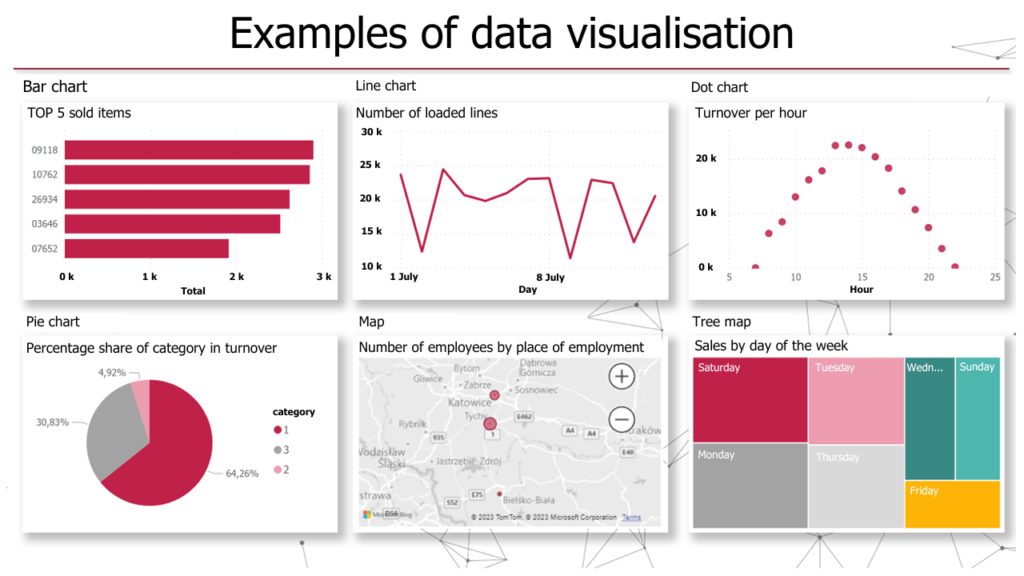
Bar chart

Example of bar chart
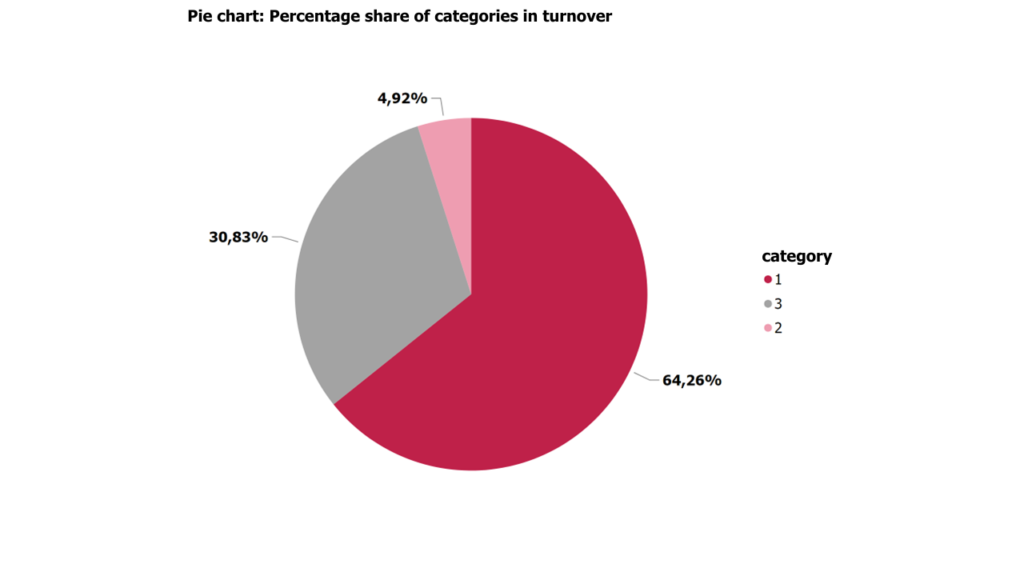
Example of pie chart
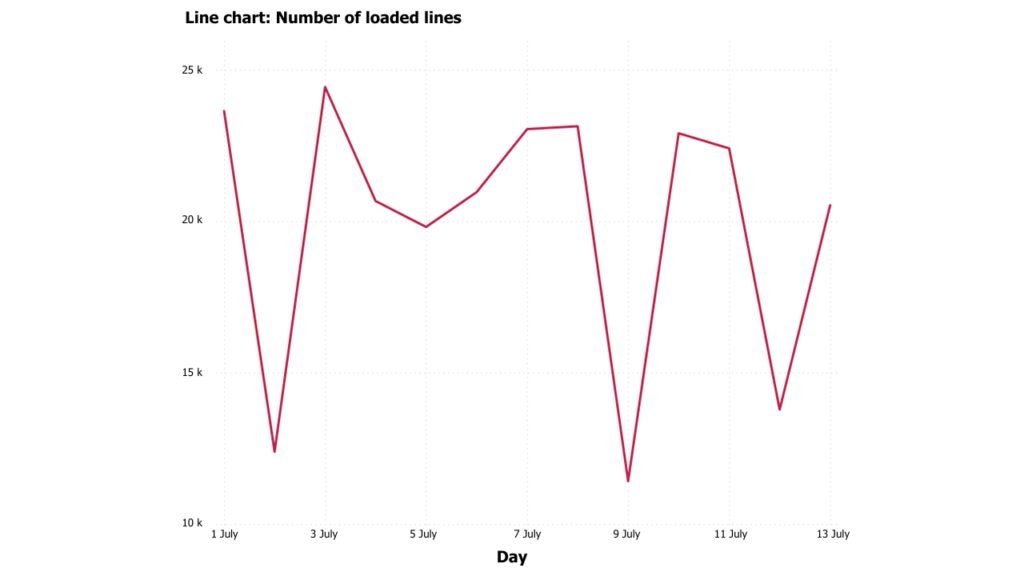
Example of line chart
Maps are a practical form of visualization. They add value especially for companies having several dispersed branches or conducting global operations. Maps can range in detail – from a province map to a world map. By presenting data on a map, one can visualize geographic trends and analysis of performance by region. A map can also be used to show demographics or other factors that affect a company’s operations (e.g. the temperature in different regions).
One should also not overlook a TreeMap. This is an effective way of visualizing hierarchical data, which represents the structure and proportions of various elements in an intuitive way. A tree map is particularly useful for representing data sheets, such as the structure of folders on the disk or the distribution of expenses. It provides an effective tool for decision-makers and analysts to quickly understand complex data hierarchies and their interrelationships. Alternatively, word clouds can be used to draw attention to emerging data trends in a maze of information. The larger the font of a word, the more relevant it is in the cloud.

Example of tree map
Various types of visualizations can be pieced together in the form of reports and infographics that can provide insights for companies, both for internal and external purposes. Owing to their standardized and transparent form, reports and infographics are a clear and readable source of knowledge for the recipient. The consistent form of the reports makes them easily comparable with each other. If possible, a report can include interactive elements that encourage the user to explore it by moving “from the general to the particular”.
Example of an infographic
In addition to the popular forms of data visualization mentioned above, many other techniques are used to present information.
Among them are Sankey charts, point cloud, Gantt charts, heatmaps or histograms. Each of them has unique features that can be tailored to specific business purposes. Nonetheless, the aforementioned charts (pie charts, bar charts, etc.) remain the most commonly chosen forms of visualization due to their readability and ability to present data in a way that is easy to understand.
It is also worth noting that all of the previously mentioned ways of data visualization can be integrated into a coherent compilation in the form of an interactive dashboard available within the Business Intelligence tool. Such a platform allows users to easily track and analyze data, providing real-time information necessary to make sound business decisions.
Data visualization in business – benefits
One of the main advantages of using data visualization in business is the ability to quickly compare indicators and metrics. By using the right tools, one can easily collate data on sales, costs, efficiency or customer satisfaction. This will help quickly identify areas for improvement and find the best strategies for action.
The visual presentation of the data also makes it easy to track progress and monitor the achievement of goals.
An important aspect of using data visualization in business analysis is the ability to easily share information with other team members. With visual presentations, results can be communicated quickly and effectively, making collaboration and decision-making easier. Many BI tools also enable creating reports in a mobile version, which means they can be accessed outside the company. Data visualization can also be used to present company results to customers and partners. It helps build trust and convince them to choose the company’s offer.
“Data visualization brings many benefits to companies that use modern BI solutions. Thanks to dedicated reports, companies are able to keep track of the results, inventories, sales or the progress of ongoing processes. Access to a standardized form of reporting enables effective verification of the updates received periodically. The reports can combine information from multiple sources in a user-friendly manner. The whole process allows one to quickly draw the right conclusions based on real and current data. In addition, interactive elements make it possible to move “from the general to the particular”, if any information needs to be clarified. On the other hand, keeping the report in the cloud means that we can use it anywhere and on any devices, including mobile ones,”
explains Anna Rotarska-Mizera.
All things considered, by visualizing data with the right tools and methods you can present complex sets of information in a comprehensible and visually appealing way. As a result, you can quickly detect trends, identify problems, and look for new growth opportunities for your company.